
📊 Full opportunity report: The Bubble Question, Disentangled: 1999 vs 2026 Category by Category on ThorstenMeyerAI.com — validation score, market gap, and execution plan.
TL;DR
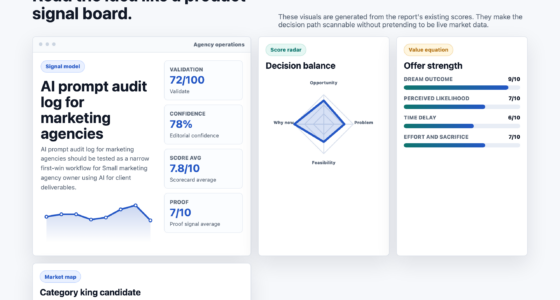
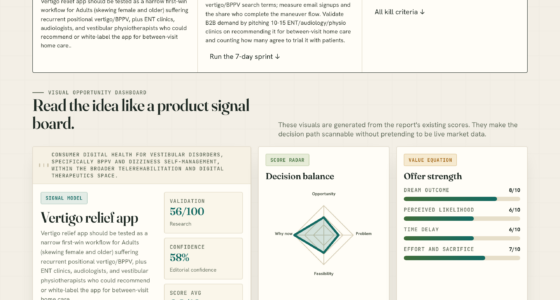
This analysis compares the current AI investment environment with the 1999 dotcom bubble, revealing which sectors show bubble signs and which demonstrate durable growth. The distinction guides strategic decisions through 2027-2030.
In May 2026, experts and investors are debating whether the current AI investment surge resembles the 1999 dotcom bubble or represents a fundamentally different cycle of durable growth. This analysis disentangles the categories to clarify which sectors exhibit bubble characteristics and which demonstrate genuine, lasting value, informing strategic decisions through 2027-2030.
The comparison between 1999 and 2026 reveals that, on price and fundamentals, the AI cycle in 2026 is more grounded than the dotcom era. Multiple expansion plays a smaller role, while earnings growth and real revenue are more prominent. Key indicators such as private valuations, capital deployment, and financing patterns, however, show bubble-like signals similar to 1999.
For instance, private valuations of AI companies like OpenAI and Anthropic reach hundreds of billions of dollars—orders of magnitude above 1999 peaks—while capital expenditure on AI infrastructure exceeds $725 billion in 2026, comparable in scale but faster in pace than the telecom buildout of the late 1990s. Meanwhile, the concentration of VC funding in a few dominant firms remains extreme, echoing the speculative frenzy of the dotcom bubble.
Experts such as Jamie Dimon and IMF economist Pierre-Olivier Gourinchas have warned about the risks of a bubble, citing the high valuation levels and capital allocation patterns. However, the presence of real earnings, productivity gains, and revenue at scale suggests that parts of the AI sector are experiencing genuine growth, complicating the bubble assessment.
Not binary.
Category by category.
Some bets show clear bubble dynamics. Some show durable value. The disentanglement matters more than the aggregate framing.
OpenAI $730B private valuation. Anthropic $380B. Mag 7 forward P/E 38× vs Dot-com peak 30×. BUT: earnings-driven returns (78%) vs Dot-com multiple-driven (314%). Real productivity gains. Mag 7 outsized free cash flow. Carlota Perez framing applies.
Two cycles. Twelve dimensions.
On price-and-fundamentals dimensions, 2024-2026 is more grounded than 1999. On capital-allocation dimensions, 2024-2026 has bubble-comparable or worse characteristics. The dual signal explains the analyst disagreement.
Five frothy. Five durable. Three contested.
The honest read: the cycle is structurally bifurcated. Some categories are not in bubble territory; others are. The contested middle is where the bubble question actually resolves through 2027-2028.
- Mega-deal concentrationOpenAI $730B, Anthropic $380B, Databricks $134B.
- Circular financingMSFT→OpenAI→CoreWeave→NVDA→MSFT loop.
- Capex velocity$725B exceeds revenue translation. $1.5T debt by 2028.
- Cahn / Sequoia argument$5T buildout requires AGI by 2030.
- Capital-flow speed$700B retail equity since Jan · 5× faster than 2000.
- Hyperscaler capex justificationCahn (only AGI) vs Goldman (justified by trajectory).
- NVIDIA addressable shareCUDA moat vs in-house silicon migration to 30-45% by 2028.
- Frontier-lab valuationsPlatform companies vs commodity API providers.
- Earnings-driven returns78% earnings · 9% multiples vs Dot-com 314% multiples.
- Mag 7 FCF + buybacksMicrosoft $90B FCF · Alphabet $70B · structural cushion.
- Profit weight matchesTech ~30% market cap, ~20% profits vs 1999 35%/10% gap.
- Forward margins recordS&P Tech margin estimates at all-time highs.
- Real productivity30-50% call center · 20-40% software eng · measurable today.
Three paths. One question.
35/50/15 probability. Base scenario most likely because durable-value supports prevent worst-case but bubble signals are too strong to resolve without correction.
- Frothy correct 30-50%Frontier labs, circular financing.
- Mag 7 sustainsReal productivity continues.
- Hyperscaler capex defensibleMixed but justified.
- NVIDIA gradual decelNot sharp.
- Outcome: Uneven returns. Big winners + losers. No broad crash.
- Frontier labs -40-60%From 2026 peaks.
- Hyperscaler impair$50-150B capex aggregate.
- NVIDIA sharp decelFY28 30-50% growth vs FY26 75%.
- NASDAQ -30-50%12-24 month period.
- Outcome: Mag 7 cushion holds. Deployment continues delayed.
- NASDAQ -60-78%Matching 2001-2003 magnitude.
- Frontier labs collapseBelow VC entry pricing.
- Hyperscaler impair $300-500BMajor capex writedowns.
- NVIDIA negative quartersRevenue compression.
- Outcome: Multi-year recovery. Deployment 2032-2033.
The 2024-2026 cycle is structurally more grounded than 1999 on price-and-fundamentals dimensions and structurally similar or worse on capital-allocation dimensions. The bifurcation explains the analyst disagreement and predicts the correction pattern: specific categories correct sharply while others persist.
Four assignments. By role.
Stop pricing AI as single asset class.
Differentiate Mag 7 (durable-value-leaning) from pure-play AI infrastructure (bubble-leaning) from contested middle (NVIDIA, frontier labs). Position long durable-value categories; short or underweight bubble-categories with circular-financing exposure. Use Perez framing to size correction expectations.
Pace through 2026-2027.
Preserve dry powder for 2028-2029. Mega-rounds at $300B+ valuations carry asymmetric correction risk. Mid-stage product-market-fit names with real revenue carry durable value through any plausible correction. The 1999 lesson: winners eventually recover; losers don’t.
Build for survivable correction.
18-24 month cash runway assumptions that survive 30-50% valuation correction. Prioritize real revenue over narrative-driven funding. Structure cap tables to absorb down-round scenarios. Peak-fundraising window of 2025-2026 may not persist; raise opportunistically while it does.
Multi-vendor sourcing for price volatility.
Plan for AI service price volatility through 2027-2028. Prices may rise (power constraint) or fall (frontier-lab competitive pressure). Multi-vendor sourcing reduces single-vendor exposure. Contractual flexibility (escalators, exit provisions, renegotiation triggers) preserves optionality.
Why Disentangling Bubble Signals Is Critical for Strategy
Understanding which AI investments are bubbles and which are durable is vital for investors, policymakers, and companies. Misjudging the cycle could lead to sharp corrections, while recognizing genuine value offers opportunities for sustainable growth. The analysis informs strategic positioning through 2027-2030, helping stakeholders avoid overexposure to bubble risks while capitalizing on real technological advances.

AI Data Center Infrastructure Engineering: Power Distribution, Liquid Cooling, High-Density Networking, and Energy Efficiency for GPU Training … Hardware & Compiler Engineering Series)
As an affiliate, we earn on qualifying purchases.
As an affiliate, we earn on qualifying purchases.
Key Historical and Current Data Comparing 1999 and 2026
The 1999 dotcom bubble saw US venture capital deploy $54 billion, with 62% flowing into unprofitable firms and NASDAQ experiencing 442 IPOs at valuations detached from fundamentals. Major companies like Pets.com and Webvan failed, while survivors like Amazon and Cisco eventually recovered and grew. The bubble burst in 2000, causing sharp corrections.
In contrast, the current AI cycle features private valuations in the hundreds of billions, extreme VC concentration (73% of AI VC funding), and massive infrastructure investments exceeding $725 billion. While some companies are unprofitable, others demonstrate real revenue, earnings, and productivity gains, suggesting a more complex environment than the straightforward bubble of 1999.
“Some AI money will be wasted, and we could see significant stock drops.”
— Jamie Dimon
Unclear Which AI Sectors Will Sustain or Correct
It remains uncertain which specific AI categories will experience sharp corrections versus those that will sustain or grow through the cycle. The pace of technological breakthroughs, regulatory developments, and macroeconomic factors could significantly influence outcomes, and some sectors may shift from bubble-like to durable or vice versa.
Monitoring Data and Policy Developments Through 2026-2030
Stakeholders should closely monitor private valuations, infrastructure investments, and regulatory signals over the coming years. Key milestones include potential IPOs of major AI firms, updates on infrastructure spending, and policy actions affecting AI deployment. These developments will clarify which segments are in bubble correction and which are on a trajectory of sustained growth.
Key Questions
How can investors distinguish between bubble and genuine AI value?
By analyzing categories based on fundamentals such as revenue, earnings, infrastructure investment, and market concentration, investors can identify which segments are driven by speculative hype and which reflect real technological progress.
Are current AI valuations justified?
Valuations in private markets are extremely high, but some sectors demonstrate real revenue and productivity gains, suggesting a mix of justified and inflated valuations. Caution is advised, especially in highly concentrated VC sectors.
What risks do bubble-like AI investments pose?
They could lead to sharp corrections, loss of capital, and reduced confidence in AI innovation. Recognizing bubble signals helps mitigate these risks by focusing on sustainable growth areas.
Will the AI cycle mirror the dotcom crash?
While some indicators resemble the dotcom bubble, the presence of real earnings and infrastructure investments suggests the cycle may have more durability. The outcome depends on how different categories evolve over the next few years.
Source: ThorstenMeyerAI.com